

Our Head of Technical Sales, Mita Chavda, recently presented at the ALSUM annual conference, discussing our modelling capabilities and the opportunity it presents for the marine insurance industry! Read on to learn more.
Mita recently presented this topic at the ALSUM annual conference. To access a recording of the presentation in Spanish please click here (Mita’s presentation is at 2 hours 40 minutes).
Today, technology is evolving at a faster rate than ever before. In the maritime insurance space, advanced algorithms and predictive modelling have become an important part of the assessment of future risk. As the adoption of innovative technology increases in the market, we must ensure that the underlying data driving these algorithms is clean and accurate to ensure that the results are truly predictive of future outcomes.
Another way to think about this idea is to imagine having a recipe to bake a cake. You could follow the recipe and instructions flawlessly, combining the correct ingredients and baking the cake at the right temperature, and at the end of process you would have a cake. However, if the ingredients you started with were of poor quality, for example, your eggs were past their use by date, then the cake is not going to be the best cake you’ve ever tasted! The same sentiment is true when using advanced algorithms in maritime insurance, the quality of the output will only be as good as the quality of the input.
Below we discuss a few of the advanced algorithms Concirrus use to help the maritime insurance community increase risk pricing accuracy, reduce losses and develop new insurance products.
Maritime insurance: Genetic optimisation algorithms
One of the ways we cleanse data in the marine hull space is by using genetic optimisation algorithms to rid vessel movement data of rogue data points. Movement data may show a steady route of multiple consecutive data points from a vessel sailing in one region. However, in the middle of the steady route there might be a few isolated data points that makes it appear as if the vessel is thousands of miles away from the true location within a matter of minutes (see figure 1). The timeline tells us that this is impossible, however rogue data points within raw location datasets are quite common.
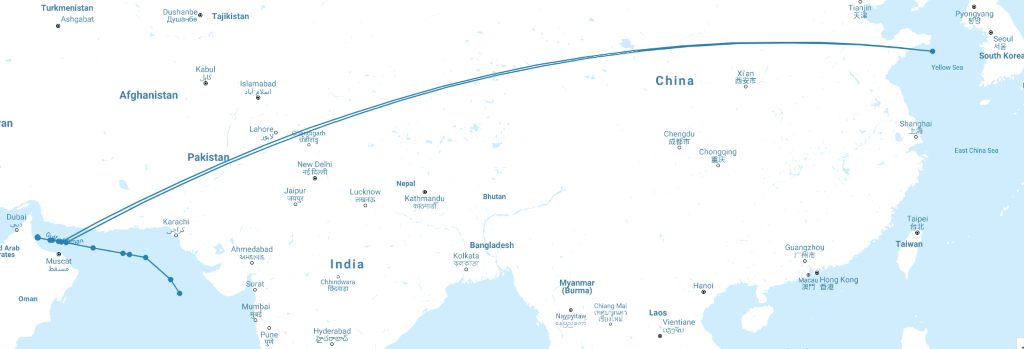
Figure 1: Example of vessel spoofing and its impact on route data
This can occur for a multitude of reasons, but generally comes down to the fact that we are using data gathered from technology that was designed for a different purpose. Automatic Identification System (AIS) is a vessel tracking system designed to alert crews of other vessels in the immediate area to prevent collisions. We’re now using this location data at a global scale to learn more about
vessel behaviour and this can result in rogue and/or missing data. The result would mean that any derived behavioural rating factors such as vessel speed and distance travelled based on this raw data would be heavily skewed and would lead to inaccurate predictions. With our advanced algorithms, we cleanse 98% of spoofed points, meaning that the data feeding our predictive models remains true to actual vessel movements.
Cargo insurance: Natural Language Processing (NLP)
Another example is our use of Natural Language Processing (NLP) to automatically categorise cargo commodities. This can be a difficult task owing to the traditional use of free text descriptions, large character limits and thousands of harmonised codes.
Our research has highlighted that as much as 80% of cargo portfolios could be categorising goods under a generic code such as “general cargo”. This results in individual risk profiles associated with specific goods being disregarded, masking pockets of low and high risk cargo that should be rated differently to help better manage risk and mitigate losses within cargo insurance. Without taking a more focused approach, the industry runs the risk of its predictive models providing the same risk rating for a container filled with cuddly toys and a container filled with fragile goods. Using NLP we can provide detailed insight into the different risk profiles within a portfolio by automatically reading commodity descriptions and categorising them correctly.
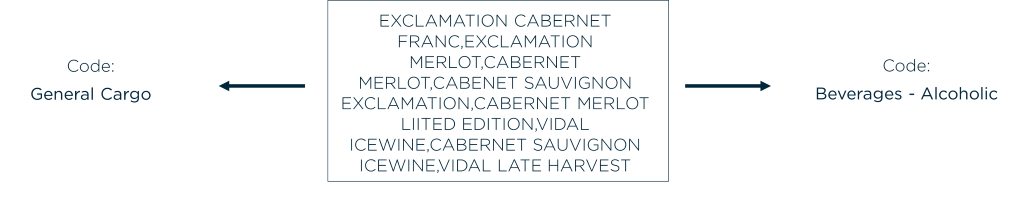
Figure 2: Example showing the recategorizing of cargo using the Concirrus commodity coder
New claims frequency and severity predictive models
Quest ingests more than three trillion raw data points and converts them into thousands of rating factors for use in more accurately pricing and managing risk.
The introduction of new behavioural rating factors such as port visits, or routes taken by individual vessels allow us to view maritime risk in a new, sophisticated way that deepens our understanding of how exposure correlates to loss. For example, when an AIS signal is received within Quest, information regarding the data, time, latitude and longitude is included within the data package. Once we have this raw data a number of rating factors relating to an individual vessel can be determined, including:
- Distance travelled
- Time taken to travel between data points
- Speed of vessel
- Any signal loss between data points
- Port visits
- Length of time in port
- Visits to high risk/sanctioned zones
- Length of time in high risk/sanctioned zones
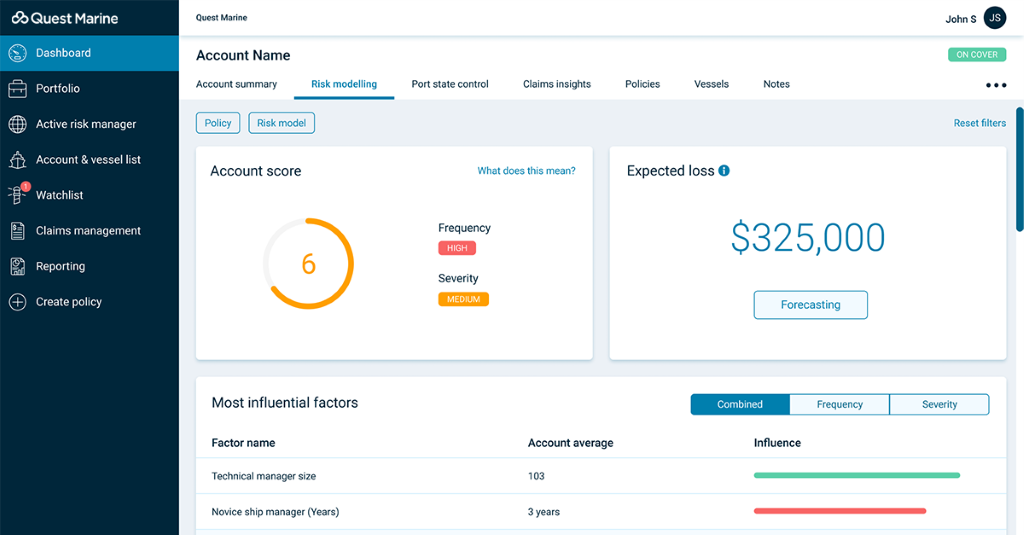
Quest combines new rating factor data, third party datasets, client exposure and claims data before running it through our machine learning framework. Using a variety of independent or stacked machine learning algorithms such as Gradient Boosting, Decision Trees, Neural Networks etc… we can identify the most reliable algorithms for use in our predictive models. Using the gini coefficient and deviance metrics to understand the predictive power of the different algorithms we can then select the most accurate and create two new models that predict:
- Frequency – the number of claims likely to occur in the following year
- Severity – the average cost of a claim
From here we can multiply the values to uncover an expected loss value and a risk score for a vessel or piece of cargo to aid with the assessment and pricing of new and existing risks more accurately. For more information on our expected loss values and risk scoring capabilities click here.
This methodology enables the maritime insurance community to evaluate vessels and cargo based on real-time behavioural data rather than static factors alone. As we saw in our recent blog: ‘A behavioural view of two ships’, whilst two vessels can look identical based on static factors, behaviour is a better indicator of risk and can help the market better understand risk selection and pricing.
In summary
With an ever-increasing amount of big data continuously training our predictive models, it is imperative that this data is complete, accurate, consistent, and valid. Failure to pay attention to the detail in the underlying data could set the industry on the wrong path resulting in unforeseen losses. Fortunately, as our predictive modelling capability has evolved, so has the technology to cleanse different data sources on a large scale. Armed with these types of revolutionary technologies, the maritime industry can work towards a safer and more profitable future.
Download our latest predictive pricing white paper below.


